
Jupyter Notebooks 환경에서 Python을 이용하여 분석하겠다.
[CSV 파일 불러오기]
bike sharing demand.csv 파일 불러오기
#Pandas : Python Data Analysis Library
#pandas imporing as pd
import pandas as pd

#bike sharing demand.csv 불러오기
#datetime → 날짜로 해석 : parse_dates option
train = pd.read_csv("bike sharing demand.csv", parse_dates=["datetime"])

#정의 된 train - data의 모양 print
print(train.shape)

#head() : train - data 상위 5개
train.head()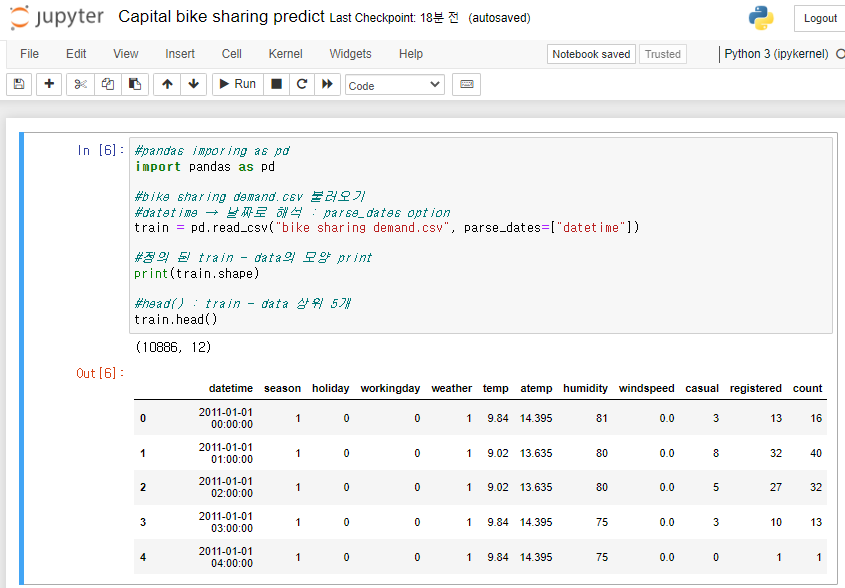
bike sharing.csv 파일 불러오기
import pandas as pd

test = pd.read_csv("bike sharing.csv", parse_dates=["datetime"])

print(test.shape)

test.head()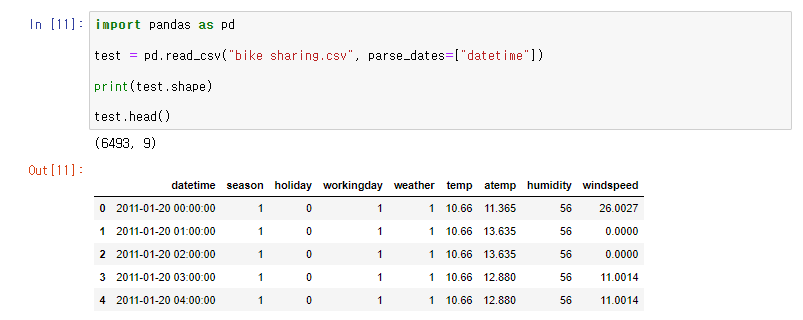
[결측값]
결측치 확인
test.isnull().sum()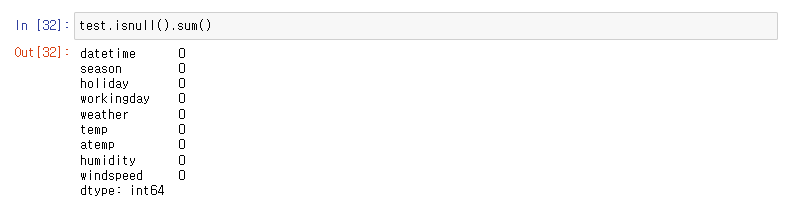
train.isnull().sum()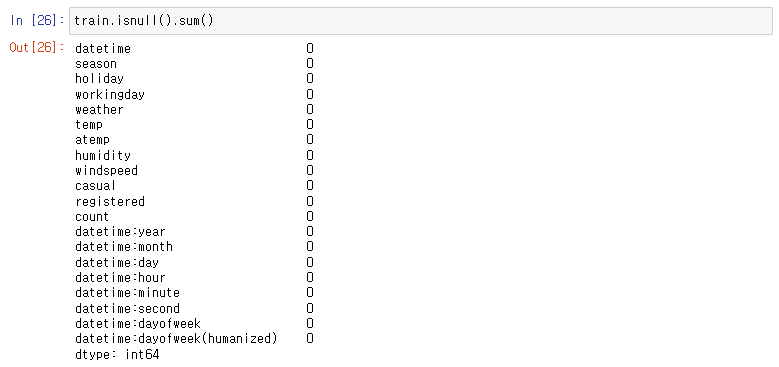
결측치 시각화
▶ ModuleNotFoundError : No module named 'missingno'
결측치를 시각화하기 위해 missingno option을 입력했지만
missingno 모듈이 설치되지 않아 에러가 떴다.
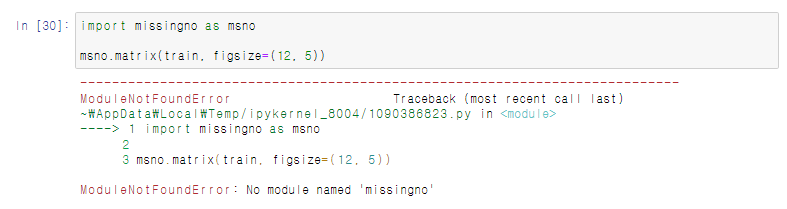
New - Terminal 접속하여 다음 코드를 입력해주면 된다.
conda install -c conda-forge missingno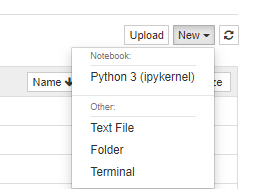
결측치 시각화 기능인 missingno module 이용
#missingno module : 결측치 시각화 기능
import missingno as msno

msno.matrix(train, figsize=(12, 5))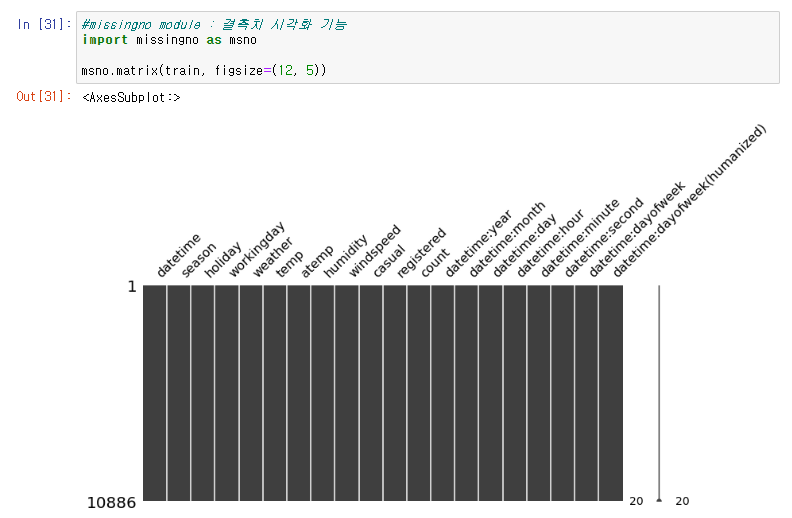
[데이터 전처리]
연월일시분초 구분하여 new col 생성
→ 시간대별 자전거 대여량 비교 위해 datetime col 쪼개기
#train data - year ~ second 구분 : new col 생성
#dt : datetime
#dt option : 연월일시분초 따로 넣어줌
train["datetime:year"] = train["datetime"].dt.year
train["datetime:month"] = train["datetime"].dt.month
train["datetime:day"] = train["datetime"].dt.day
train["datetime:hour"] = train["datetime"].dt.hour
train["datetime:minute"] = train["datetime"].dt.minute
train["datetime:second"] = train["datetime"].dt.second

#dayofweek : 날짜 → 요일 추출 기능
#0(월), 1(화) ~ 6(일)
train["datetime:dayofweek"] = train["datetime"].dt.dayofweek

print(train.shape)

#head() : 상위 5개 data 보여줌
#datetime & year ~ second % dayofweek만 출력
train[["datetime", "datetime:year", "datetime:month", "datetime:day", "datetime:hour",
      "datetime:minute", "datetime:second", "datetime:second", "datetime:dayofweek"]].head()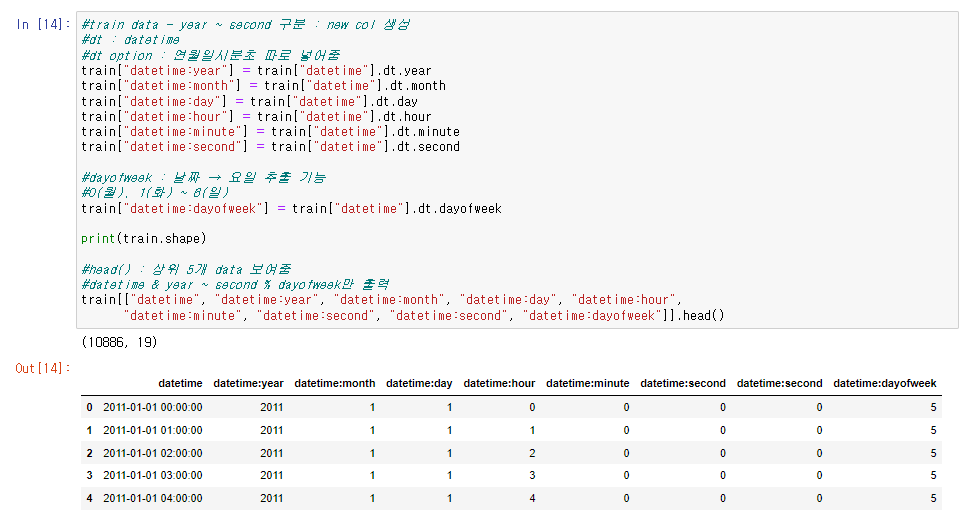
datetime 날짜 형식 -> 숫자 변환 / 변경된 요일 -> humanized 새로운 col 추가
→ 머신 러닝 알고리즘 사용 위해 숫자 날짜 컬럼을 숫자로 변환
datetime & 요일 : 숫자로 변환
→ 시각화 분석 위해 요일 col을 문자로 된 col으로 추가 생성
humanized : 인간화된 (사람이 보기 쉽게)
#datetime col(날짜 형식)→ 숫자로 변환
#datetime:dayofweek → Monday ~ Sunday 변경
#변경한 요일을 datetime:dayofweek(humanized) 새로운 col 추가
train.loc[train["datetime:dayofweek"] == 0, "datetime:dayofweek(humanized)"] = "Monday"
train.loc[train["datetime:dayofweek"] == 1, "datetime:dayofweek(humanized)"] = "Tuesday"
train.loc[train["datetime:dayofweek"] == 2, "datetime:dayofweek(humanized)"] = "Wednesday"
train.loc[train["datetime:dayofweek"] == 3, "datetime:dayofweek(humanized)"] = "Thursday"
train.loc[train["datetime:dayofweek"] == 4, "datetime:dayofweek(humanized)"] = "Friday"
train.loc[train["datetime:dayofweek"] == 5, "datetime:dayofweek(humanized)"] = "Saturday"
train.loc[train["datetime:dayofweek"] == 6, "datetime:dayofweek(humanized)"] = "Sunday"

print(train.shape)

train[["datetime", "datetime:dayofweek", "datetime:dayofweek(humanized)"]].head()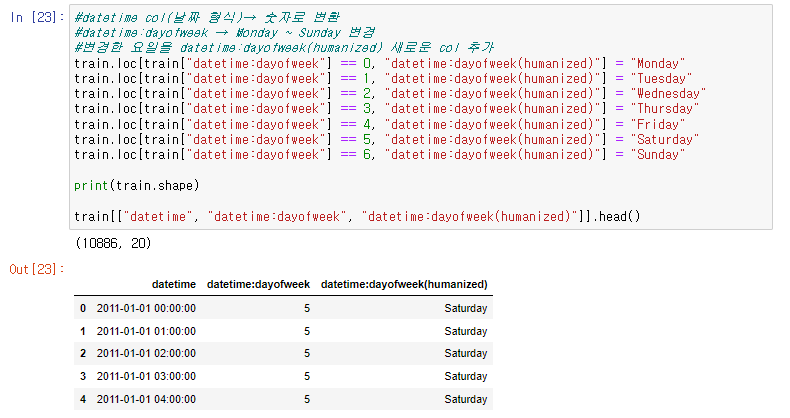
[시각화]
시각화 1
▶ NameError : name 'plt' is not defined
plt의 정의가 되지 않아 에러가 났다.

아래 코드를 추가해준다.
from matplotlib import pyplot as plt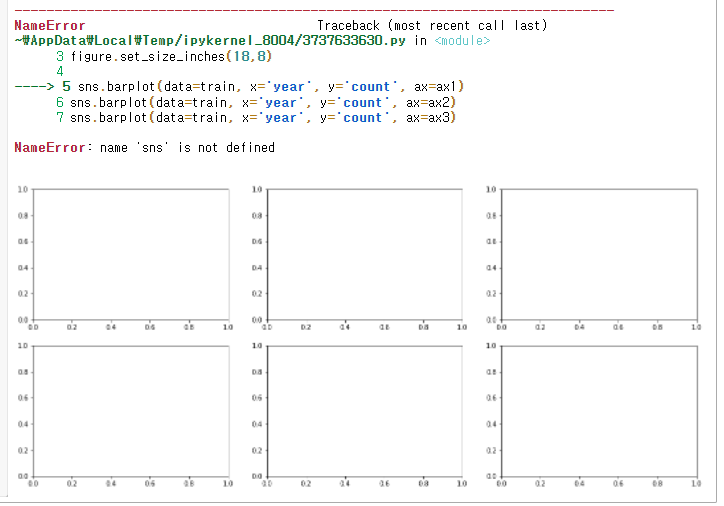
▶NameError : name 'sns' is not defined
sns가 정의되지 않아 에러.
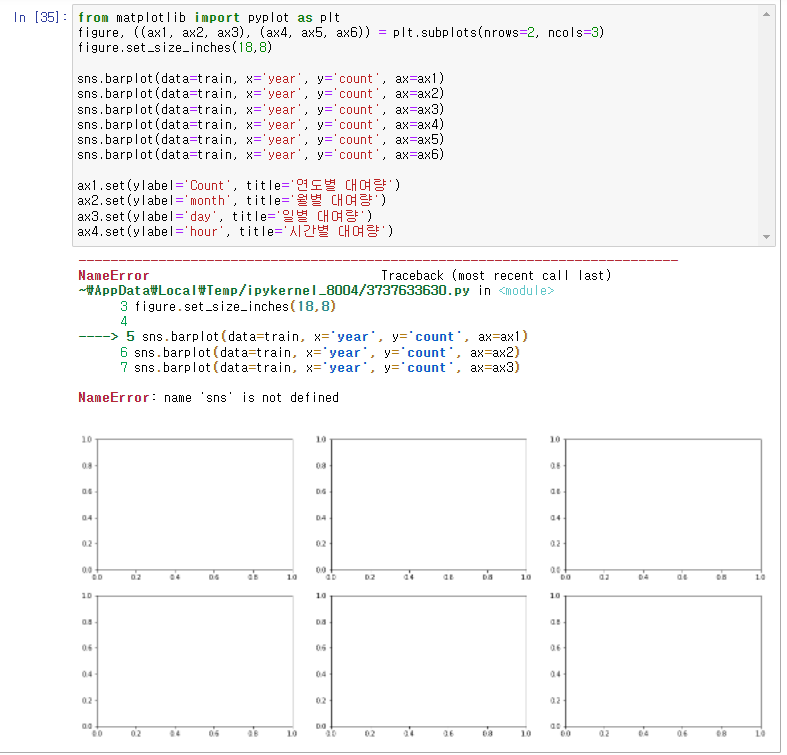
아래 코드를 추가해줘야 한다.
import seaborn as sns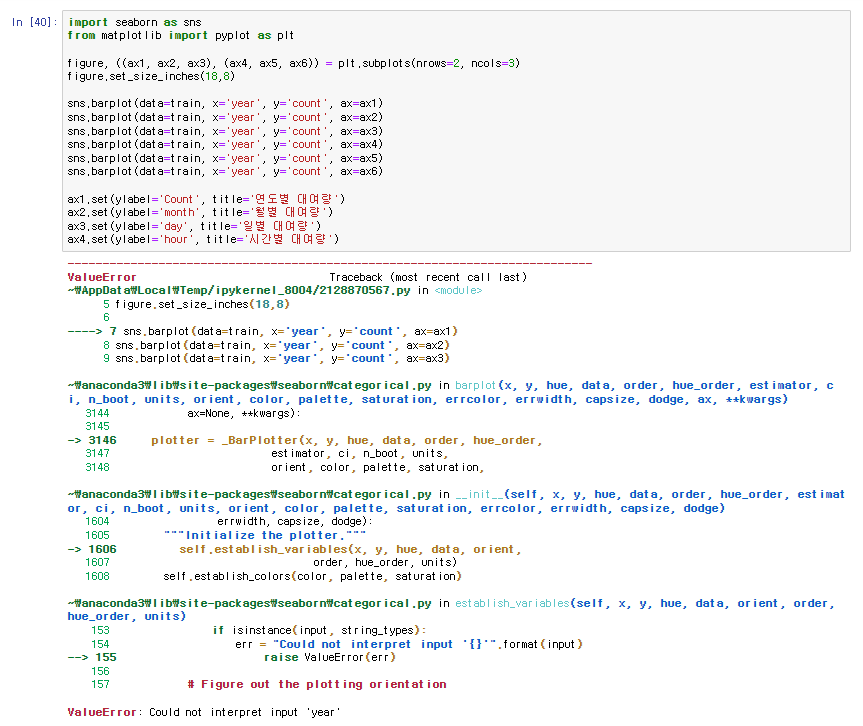
▶ValueError : Could not interpret input 'year'
year은 아까 datetime:year로 정의했었다.
코드 수정 필요.
year -> datetime:year
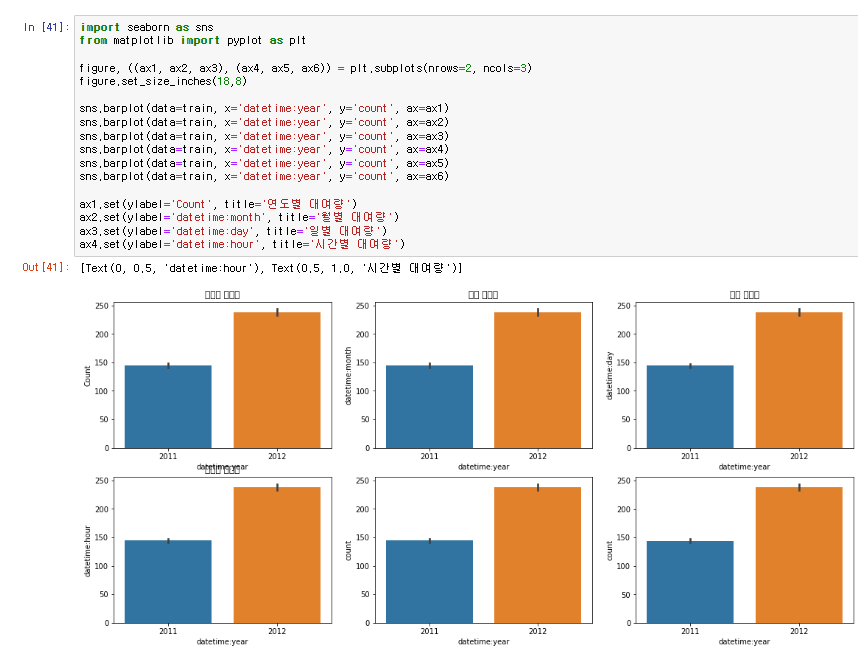
▶ 그래프 오류
시각화 되어야 하는 다양한 그래프가 한 종류밖에 나오지 않는 것 같다.
알고보니 x값을 datetime:year로 다 해놓은 것이 원인이었다.
각각 datetime:month ~ datetime:second로 지정해준다.
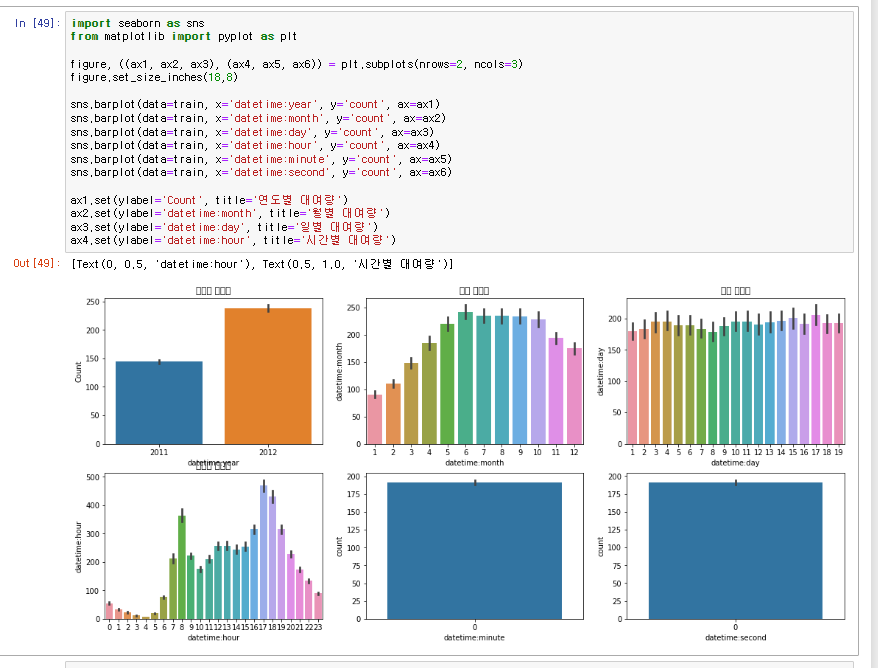
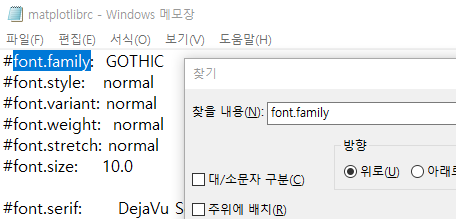
▶ 1-1. 그래프 내 한글 깨짐 현상
□□□ 이런 식으로 한글이 깨지는 현상이 발생했다.
https://hangeul.naver.com/2017/nanum
네이버 글꼴 모음
네이버가 만든 150여종의 글꼴을 한번에 만나보세요
hangeul.naver.com
마루 부리 글씨체가 깔끔하고 개성 있으므로 마루 부리로 하겠다.
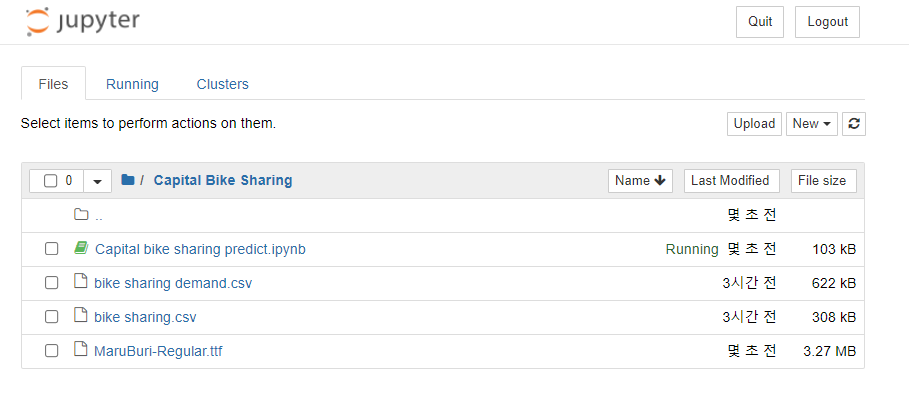
글씨체를 다운 받은 후 ttf 파일을 작업 중인 ipynb 파일과 같은 폴더 내 업로드 시킨다.
▶ 1-2. (그래프 내 한글 깨짐 현상) AttributeError : module 'matplotlib.font_manager' has no attribute '_rebuild'

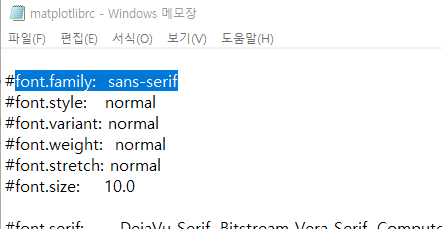
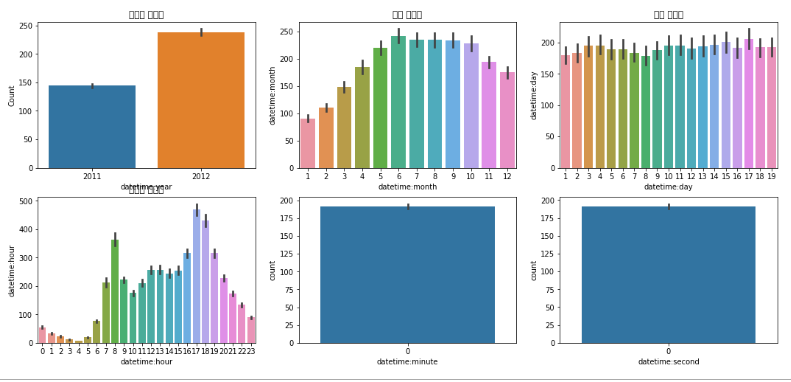
아무리 해도 안되길래 영문으로 일단 바꿨다.
1. 연도별 대여량 : 2011년보다 2012년도 대여량이 크게 증가하였다.
2. 월별 대여량 : 온도가 낮을 수록 자전거 대여량이 감소한다.
3. 일별 대여량 :
import seaborn as sns
from matplotlib import pyplot as plt


figure, ((ax1, ax2, ax3), (ax4, ax5, ax6)) = plt.subplots(nrows=2, ncols=3)
figure.set_size_inches(18,8)

sns.barplot(data=train, x='datetime:year', y='count', ax=ax1)
sns.barplot(data=train, x='datetime:month', y='count', ax=ax2)
sns.barplot(data=train, x='datetime:day', y='count', ax=ax3)
sns.barplot(data=train, x='datetime:hour', y='count', ax=ax4)
sns.barplot(data=train, x='datetime:minute', y='count', ax=ax5)
sns.barplot(data=train, x='datetime:second', y='count', ax=ax6)

ax1.set(ylabel='Count', title='Annual rental volume')
ax2.set(ylabel='datetime:month', title='Monthly rental volume')
ax3.set(ylabel='datetime:day', title='Daily rental volume')

ax4.set(ylabel='datetime:hour', title='Hourly rental volume')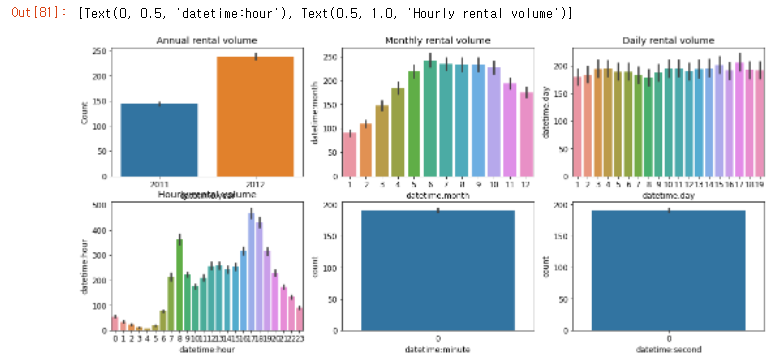
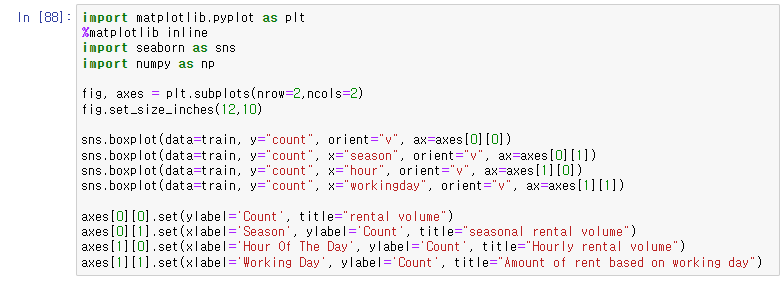
시각화 2
▶ SyntaxError : positional argument follows keyword argument
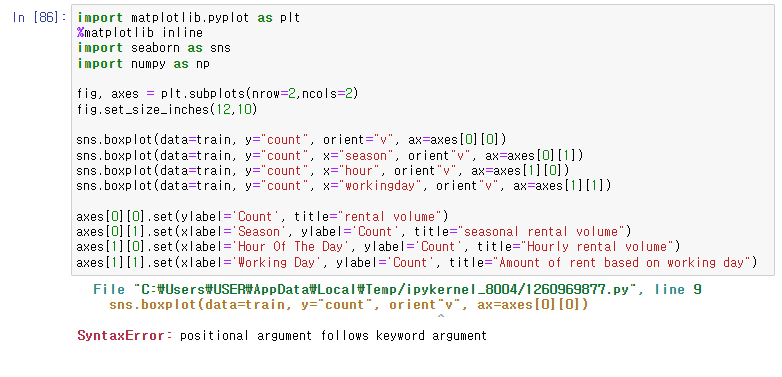
"v" 중 "가 문제인가? 봤더니 =를 적지 않아서 생긴 오류였다.
orient="v"▶ TypeError : __init__() got an unexpected keyword argument 'nrow'
아래는 위 코드에 대한 오류 설명이다.
---------------------------------------------------------------------------
TypeError                                 Traceback (most recent call last)
~\AppData\Local\Temp/ipykernel_8004/3540247715.py in <module>
      4 import numpy as np
      5
----> 6 fig, axes = plt.subplots(nrow=2,ncols=2)
      7 fig.set_size_inches(12,10)
      8

~\anaconda3\lib\site-packages\matplotlib\_api\deprecation.py in wrapper(*args, **kwargs)
    469                 "parameter will become keyword-only %(removal)s.",
    470                 name=name, obj_type=f"parameter of {func.__name__}()")
--> 471         return func(*args, **kwargs)
    472
    473     return wrapper

~\anaconda3\lib\site-packages\matplotlib\pyplot.py in subplots(nrows, ncols, sharex, sharey, squeeze, subplot_kw, gridspec_kw, **fig_kw)
   1437
   1438     """
-> 1439     fig = figure(**fig_kw)
   1440     axs = fig.subplots(nrows=nrows, ncols=ncols, sharex=sharex, sharey=sharey,
   1441                        squeeze=squeeze, subplot_kw=subplot_kw,

~\anaconda3\lib\site-packages\matplotlib\pyplot.py in figure(num, figsize, dpi, facecolor, edgecolor, frameon, FigureClass, clear, **kwargs)
    795                 RuntimeWarning)
    796
--> 797         manager = new_figure_manager(
    798             num, figsize=figsize, dpi=dpi,
    799             facecolor=facecolor, edgecolor=edgecolor, frameon=frameon,

~\anaconda3\lib\site-packages\matplotlib\pyplot.py in new_figure_manager(*args, **kwargs)
    314     """Create a new figure manager instance."""
    315     _warn_if_gui_out_of_main_thread()
--> 316     return _backend_mod.new_figure_manager(*args, **kwargs)
    317
    318

~\anaconda3\lib\site-packages\matplotlib\backend_bases.py in new_figure_manager(cls, num, *args, **kwargs)
   3542         from matplotlib.figure import Figure
   3543         fig_cls = kwargs.pop('FigureClass', Figure)
-> 3544         fig = fig_cls(*args, **kwargs)
   3545         return cls.new_figure_manager_given_figure(num, fig)
   3546

TypeError: __init__() got an unexpected keyword argument 'nrow'nrows를 nrow로 잘못 표기한 것에 대한 오류이다.
▶ ValueError : Could not interpret input 'hour'
다음은 위 코드에 대한 에러 설명이다.
---------------------------------------------------------------------------
ValueError                                Traceback (most recent call last)
~\AppData\Local\Temp/ipykernel_8004/2774925426.py in <module>
      9 sns.boxplot(data=train, y="count", orient="v", ax=axes[0][0])
     10 sns.boxplot(data=train, y="count", x="season", orient="v", ax=axes[0][1])
---> 11 sns.boxplot(data=train, y="count", x="hour", orient="v", ax=axes[1][0])
     12 sns.boxplot(data=train, y="count", x="workingday", orient="v", ax=axes[1][1])
     13

~\anaconda3\lib\site-packages\seaborn\categorical.py in boxplot(x, y, hue, data, order, hue_order, orient, color, palette, saturation, width, dodge, fliersize, linewidth, whis, notch, ax, **kwargs)
   2227             whis=1.5, notch=False, ax=None, **kwargs):
   2228
-> 2229     plotter = _BoxPlotter(x, y, hue, data, order, hue_order,
   2230                           orient, color, palette, saturation,
   2231                           width, dodge, fliersize, linewidth)

~\anaconda3\lib\site-packages\seaborn\categorical.py in __init__(self, x, y, hue, data, order, hue_order, orient, color, palette, saturation, width, dodge, fliersize, linewidth)
    444                  width, dodge, fliersize, linewidth):
    445
--> 446         self.establish_variables(x, y, hue, data, orient, order, hue_order)
    447         self.establish_colors(color, palette, saturation)
    448

~\anaconda3\lib\site-packages\seaborn\categorical.py in establish_variables(self, x, y, hue, data, orient, order, hue_order, units)
    153                 if isinstance(input, string_types):
    154                     err = "Could not interpret input '{}'".format(input)
--> 155                     raise ValueError(err)
    156
    157             # Figure out the plotting orientation

ValueError: Could not interpret input 'hour'

findfont: Font family ['GOTHIC'] not found. Falling back to DejaVu Sans.
x="hour" 이 값이 잘못됐다. hour 값이 아닌 datetime:hour 값으로 이름을 매겼기 때문이다.
import matplotlib.pyplot as plt
%matplotlib inline
import seaborn as sns
import numpy as np
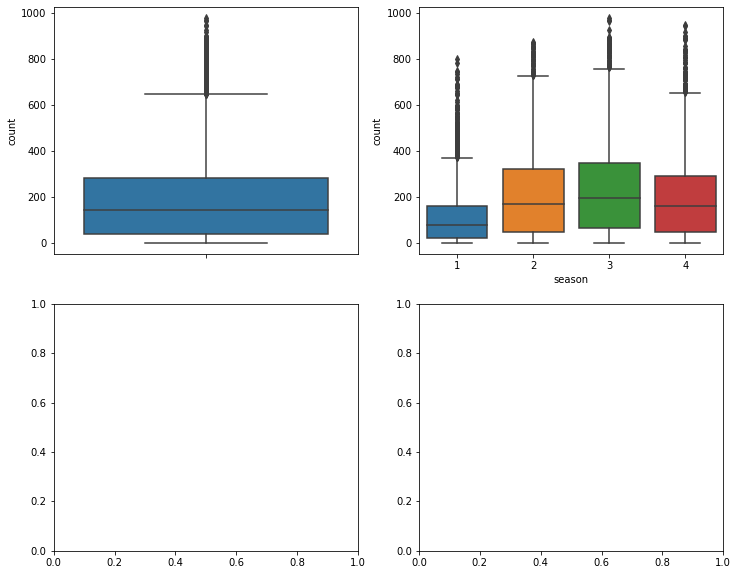
fig, axes = plt.subplots(nrows=2,ncols=2)
fig.set_size_inches(12,10)
sns.boxplot(data=train, y="count", orient="v", ax=axes[0][0])
sns.boxplot(data=train, y="count", x="season", orient="v", ax=axes[0][1])
sns.boxplot(data=train, y="count", x="datetime:hour", orient="v", ax=axes[1][0])
sns.boxplot(data=train, y="count", x="workingday", orient="v", ax=axes[1][1])
axes[0][0].set(ylabel='Count', title="rental volume")
axes[0][1].set(xlabel='Season', ylabel='Count', title="seasonal rental volume")
axes[1][0].set(xlabel='Hour Of The Day', ylabel='Count', title="Hourly rental volume")
axes[1][1].set(xlabel='Working Day', ylabel='Count', title="Amount of rent based on working day")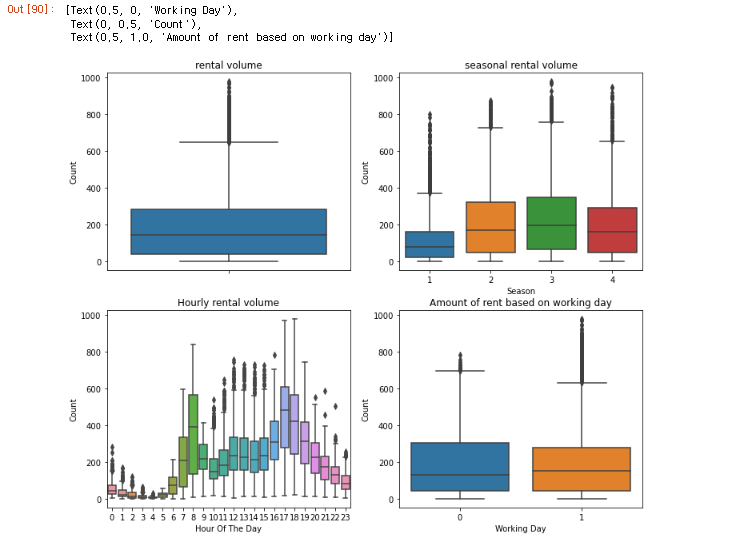
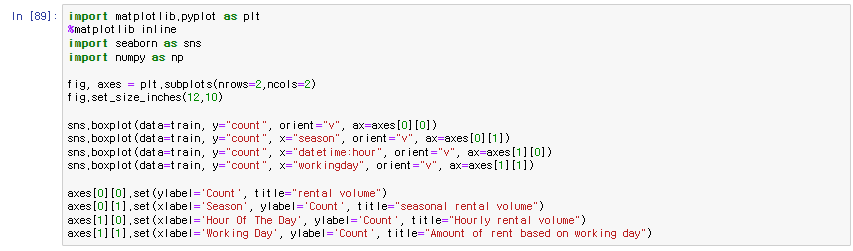
▶ SyntaxError : unexpected E0F while parsing
에러가 났다. 분명 내가 무언가를 잘못 썼을 것.
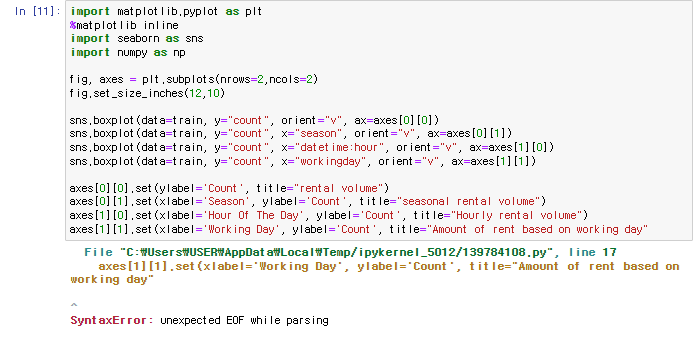
맨 마지막 코드 day" 뒤에 ) 를 쓰지 않아서 에러가 생긴 것이었다.
import matplotlib.pyplot as plt
%matplotlib inline
import seaborn as sns
import numpy as np

fig, axes = plt.subplots(nrows=2,ncols=2)
fig.set_size_inches(12,10)

sns.boxplot(data=train, y="count", orient="v", ax=axes[0][0])
sns.boxplot(data=train, y="count", x="season", orient="v", ax=axes[0][1])
sns.boxplot(data=train, y="count", x="datetime:hour", orient="v", ax=axes[1][0])
sns.boxplot(data=train, y="count", x="workingday", orient="v", ax=axes[1][1])

axes[0][0].set(ylabel='Count', title="rental volume")
axes[0][1].set(xlabel='Season', ylabel='Count', title="seasonal rental volume")
axes[1][0].set(xlabel='Hour Of The Day', ylabel='Count', title="Hourly rental volume")
axes[1][1].set(xlabel='Working Day', ylabel='Count', title="Amount of rent based on working day")import matplotlib.pyplot as plt
%matplotlib inline
import seaborn as sns
import numpy as np
fig, axes = plt.subplots(nrows=2,ncols=2)
fig.set_size_inches(12,10)
sns.boxplot(data=train, y="count", orient="v", ax=axes[0][0])
sns.boxplot(data=train, y="count", x="season", orient="v", ax=axes[0][1])
sns.boxplot(data=train, y="count", x="datetime:hour", orient="v", ax=axes[1][0])
sns.boxplot(data=train, y="count", x="workingday", orient="v", ax=axes[1][1])
axes[0][0].set(ylabel='Count', title="rental volume")
axes[0][1].set(xlabel='Season', ylabel='Count', title="seasonal rental volume")
axes[1][0].set(xlabel='Hour Of The Day', ylabel='Count', title="Hourly rental volume")
axes[1][1].set(xlabel='Working Day', ylabel='Count', title="Amount of rent based on working day")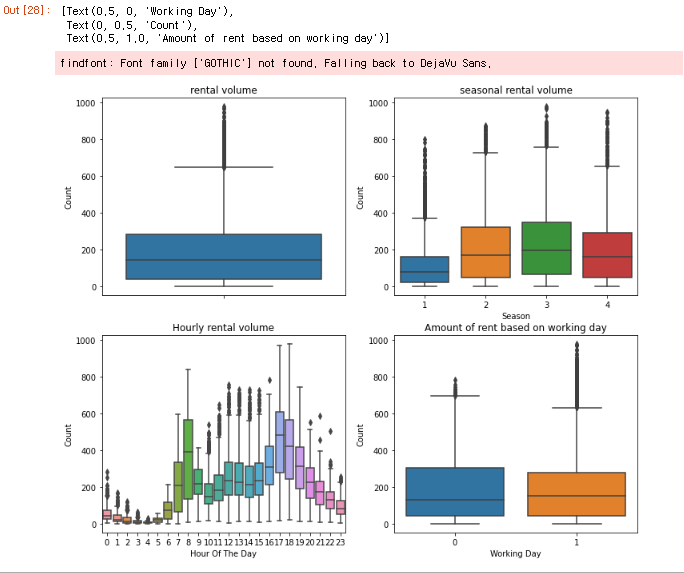
시각화 3
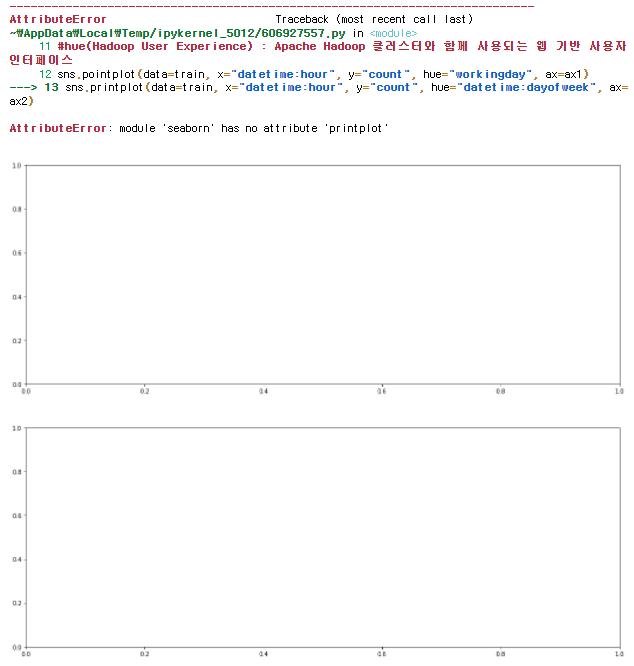
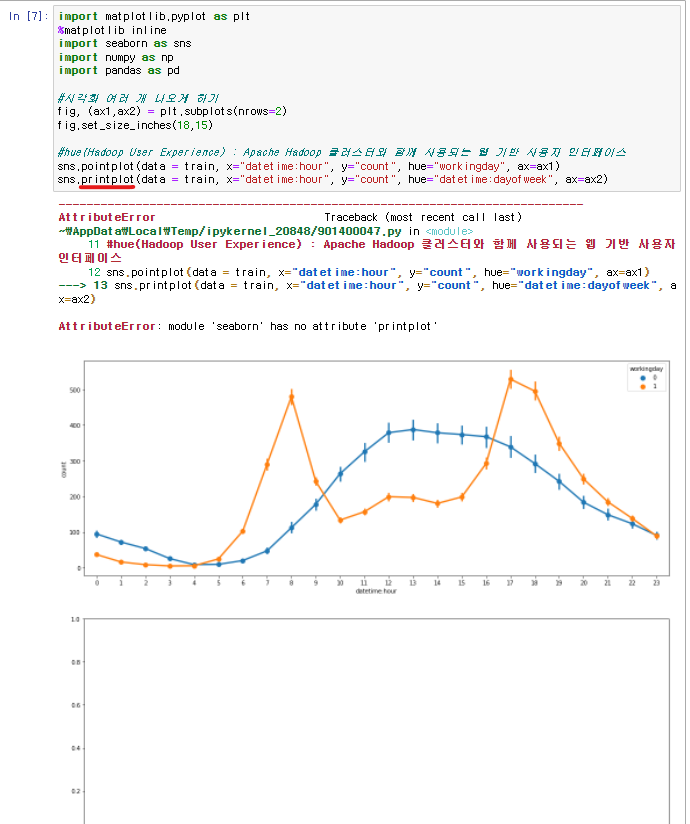
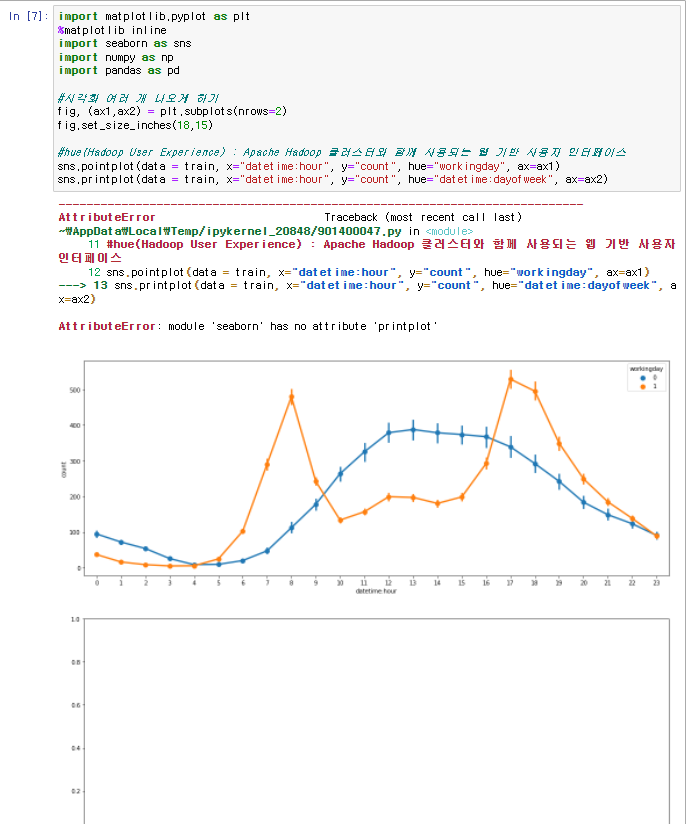
▶ AttributeError : module 'seaborn' has no attribute 'printplot'
import matplotlib.pyplot as plt
%matplotlib inline
import seaborn as sns
import numpy as np

fig, (ax,ax2) = plt.subplots(nrows=2)
fig.set_size_inches(18,15)

sns.pointplot(data=train, x="datetime:hour", y="count", hue="workingday", ax=ax)
sns.printplot(data=train, x="datetime:hour", y="count", hue="datetime:dayofweek", ax=ax2)다음은 위 코드에 대한 에러 설명문이다.
---------------------------------------------------------------------------
AttributeError                            Traceback (most recent call last)
~\AppData\Local\Temp/ipykernel_8004/1109192431.py in <module>
      3
      4 sns.pointplot(data=train, x="datetime:hour", y="count", hue="workingday", ax=ax)
----> 5 sns.printplot(data=train, x="datetime:hour", y="count", hue="datetime:dayofweek", ax=ax2)

AttributeError: module 'seaborn' has no attribute 'printplot'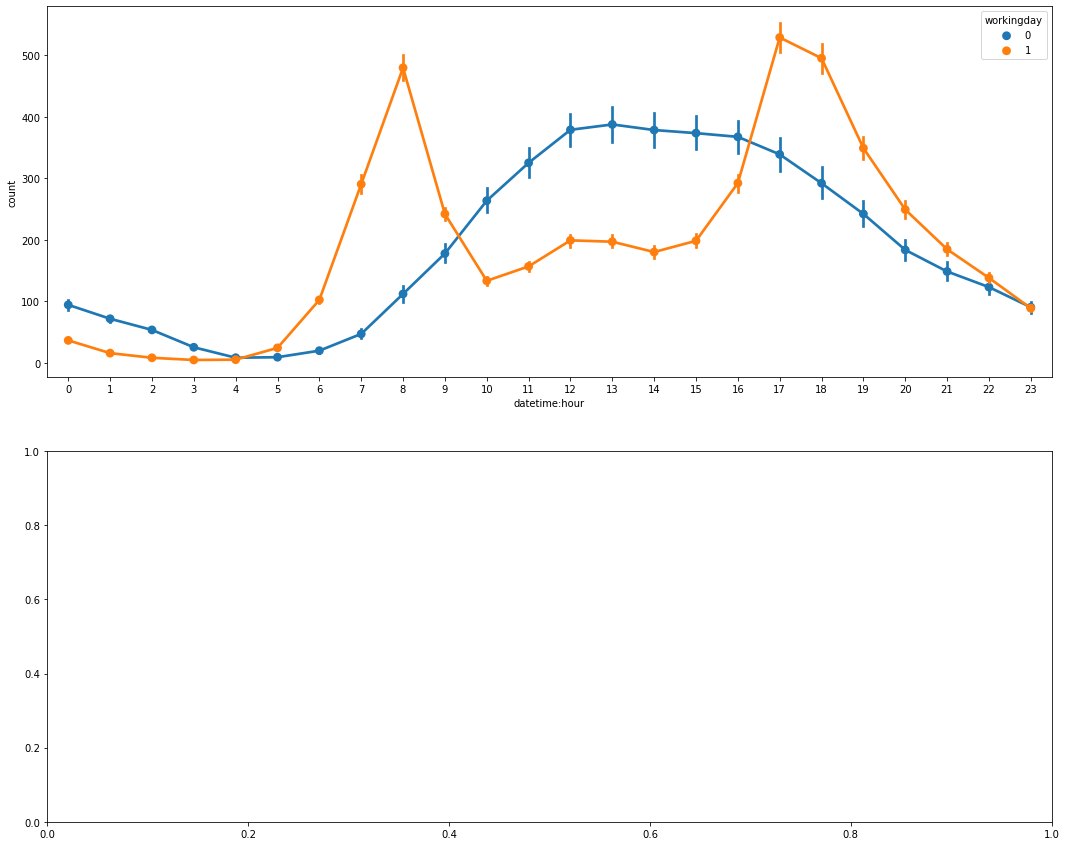
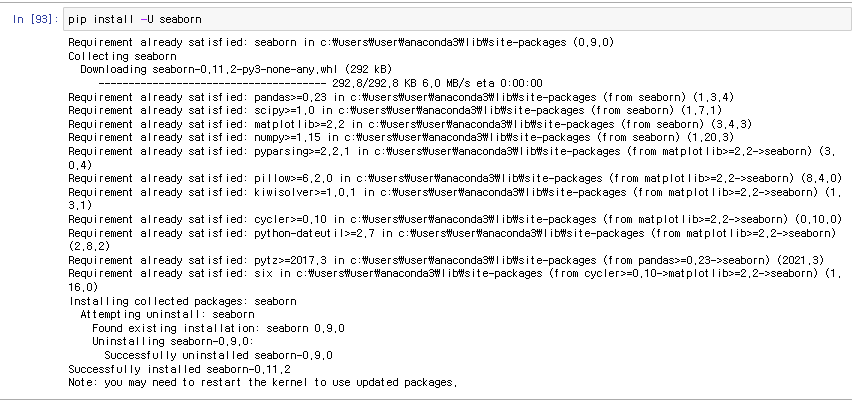
seaborn을 설치하면 된다.
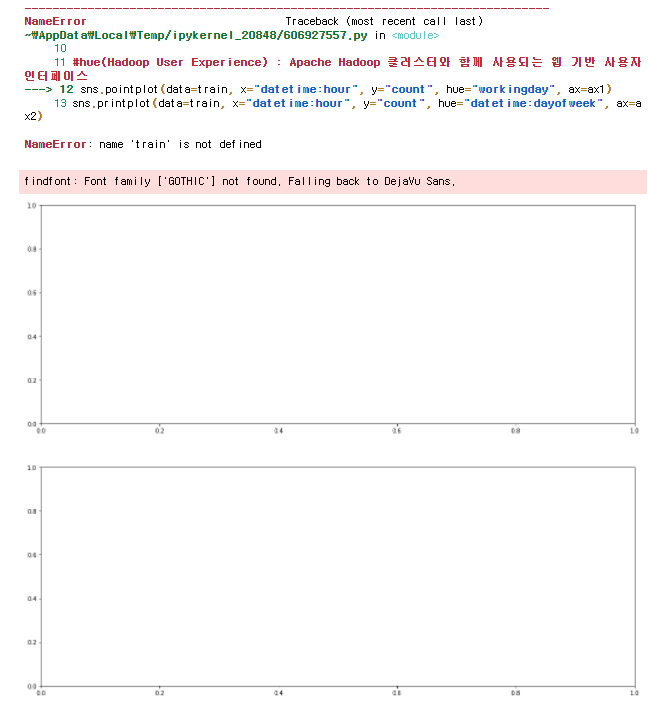
▶ NameError : name 'train' is not defined
train이 정의가 되어 있지 않다고 나왔다.
import matplotlib.pyplot as plt
%matplotlib inline
import seaborn as sns
import numpy as np

fig, (ax,ax2) = plt.subplots(nrows=2)
fig.set_size_inches(18,15)

sns.pointplot(data=train, x="datetime:hour", y="count", hue="workingday", ax=ax)
sns.printplot(data=train, x="datetime:hour", y="count", hue="datetime:dayofweek", ax=ax2)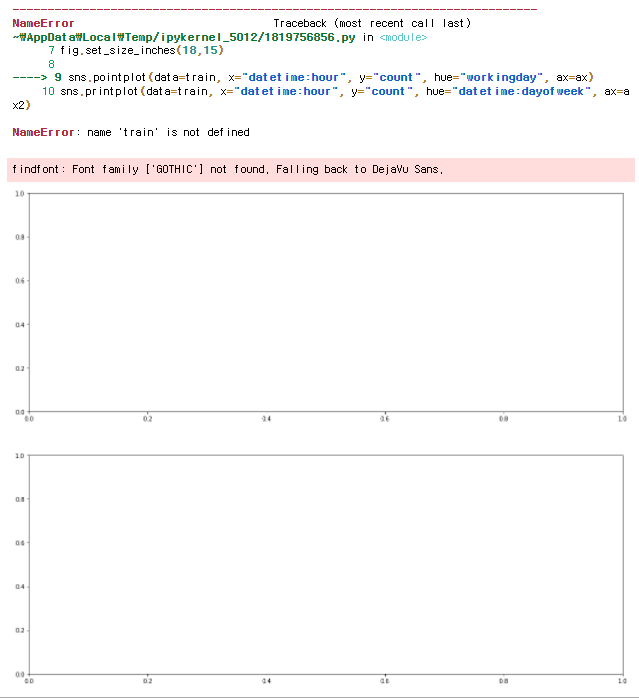
import matplotlib.pyplot as plt
%matplotlib inline
import seaborn as sns
import numpy as np
import pandas as pd

train = pd.read_csv("bike sharing demand.csv", parse_dates=["datetime"])

fig, (ax,ax2) = plt.subplots(nrows=2)
fig.set_size_inches(18,15)

sns.pointplot(data=train, x="datetime:hour", y="count", hue="workingday", ax=ax)
sns.printplot(data=train, x="datetime:hour", y="count", hue="datetime:dayofweek", ax=ax2)
▶ NameError : name 'pd' is not defined
pd 또한 정의해주어야 한다.
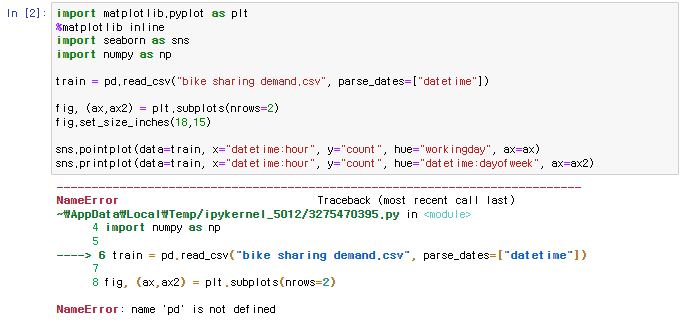
import pandas as pd 로 pd를 정의해주자.
import matplotlib.pyplot as plt
%matplotlib inline
import seaborn as sns
import numpy as np
import pandas as pd

train = pd.read_csv("bike sharing demand.csv", parse_dates=["datetime"])

fig, (ax,ax2) = plt.subplots(nrows=2)
fig.set_size_inches(18,15)

sns.pointplot(data=train, x="datetime:hour", y="count", hue="workingday", ax=ax)
sns.printplot(data=train, x="datetime:hour", y="count", hue="datetime:dayofweek", ax=ax2)▶ ValueError : Could not interpret input 'datetime:hour'
datetime:hour 잘 적었는데 뭐가 문제지..?
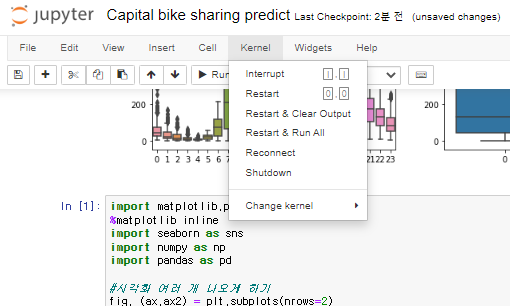
일단 주피터노트북 끄고 다시 재접속한거라
위 코드들을 각각 실행시키고 나서 실행시켰더니 넘어간 것 같다.
import matplotlib.pyplot as plt
%matplotlib inline
import seaborn as sns
import numpy as np
import pandas as pd

#시각화 여러 개 나오게 하기
fig, (ax,ax2) = plt.subplots(nrows=2)
fig.set_size_inches(18,15)

#hue(Hadoop User Experience) : Apache Hadoop 클러스터와 함께 사용되는 웹 기반 사용자 인터페이스
sns.pointplot(data=train, x="datetime:hour", y="count", hue="workingday", ax=ax1)
sns.printplot(data=train, x="datetime:hour", y="count", hue="datetime:dayofweek", ax=ax2)▶ AttributeError : module 'seaborn' has no attribute 'printplot'
import matplotlib.pyplot as plt
%matplotlib inline
import seaborn as sns
import numpy as np
import pandas as pd

#시각화 여러 개 나오게 하기
fig, (ax,ax2) = plt.subplots(nrows=2)
fig.set_size_inches(18,15)

#hue(Hadoop User Experience) : Apache Hadoop 클러스터와 함께 사용되는 웹 기반 사용자 인터페이스
sns.pointplot(data=train, x="datetime:hour", y="count", hue="workingday", ax=ax1)
sns.printplot(data=train, x="datetime:hour", y="count", hue="datetime:dayofweek", ax=ax2)
seaborn 설치하고 커널 재시작
결과)
아래 에러를 해결했는데 다시 이 에러가 나왔다.
구글 검색을 해봐도 printplot에 대한 에러가 없었다.
없는 이유가 있다. 코드 에러는 인간인 내 잘못이 99.99999999%다.
pointplot을 printplot이라고 적어버린 것이 에러의 원인이었다.
어쩐지 ax1은 잘 나오는데 ax2만 그래프가 안나온다 했다.
그래도 컴퓨터는 답이 있어서 좋다.
ㅋㅋㅋㅋㅋㅋㅋㅋㅋㅋㅋㅋㅋㅋㅋㅋㅋㅋㅋㅋㅋㅋㅋㅋㅋㅋㅋㅋㅋㅋㅋㅋㅋㅋㅋㅋㅋㅋㅋㅋㅋㅋㅋㅋㅋㅋ
▶ NameError : name 'train' is not defined
위에 csv 불러온 파일을 train으로 정의한 코드들 실행시켜줬더니 해당 에러가 사라졌다.
▶ NameError : name 'ax1' is not defined
밑에서 두 번째 줄 맨 끝 ax=ax1로 바꿨는데
가운데 줄 fig, (ax, ax2) 부분에서는 바꾸지 않았다.
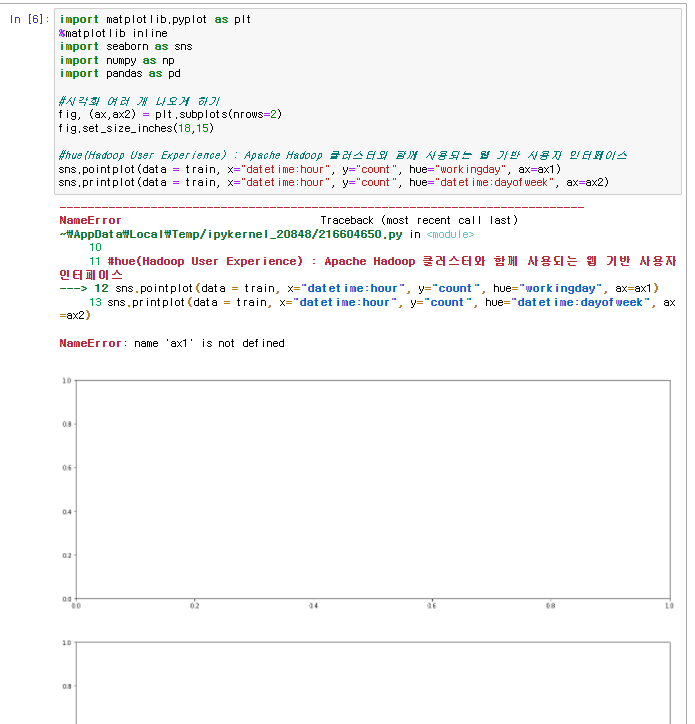
ax1, ax2로 바꿔준다.
import matplotlib.pyplot as plt
%matplotlib inline
import seaborn as sns
import numpy as np
import pandas as pd
#시각화 여러 개 나오게 하기
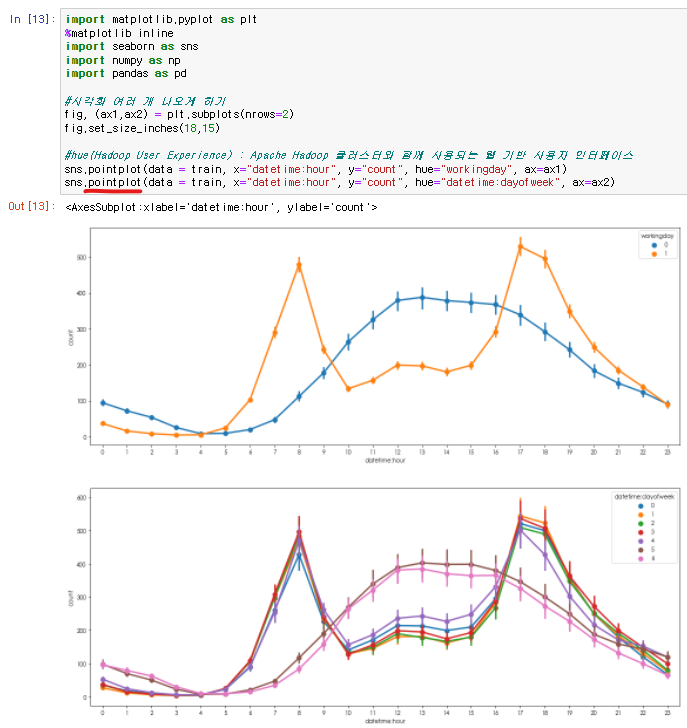
fig, (ax1,ax2) = plt.subplots(nrows=2)
fig.set_size_inches(18,15)
#hue(Hadoop User Experience) : Apache Hadoop 클러스터와 함께 사용되는 웹 기반 사용자 인터페이스
sns.pointplot(data = train, x="datetime:hour", y="count", hue="workingday", ax=ax1)
sns.pointplot(data = train, x="datetime:hour", y="count", hue="datetime:dayofweek", ax=ax2)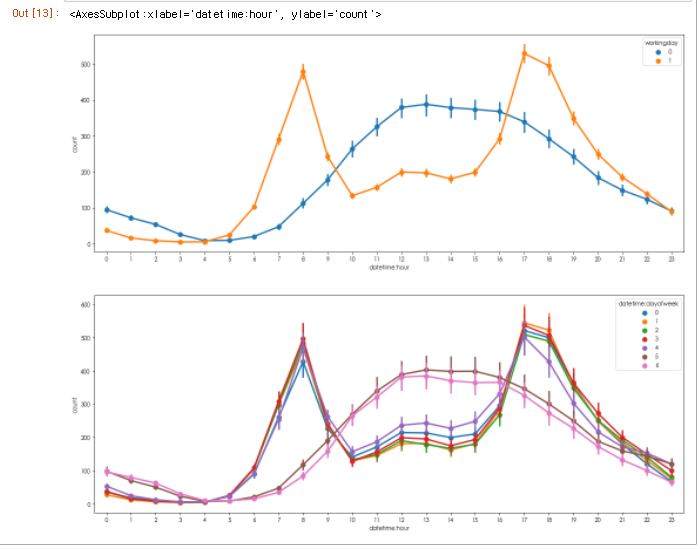
시각화 4
import matplotlib.pyplot as plt
%matplotlib inline
import seaborn as sns
import numpy as np
import pandas as pd

fig,(ax1,ax2) = plt.subplots(nrows=2)
fig.set_size_inches(18,15)

sns.pointplot(data = train, x="datetime:hour", y="count", hue="weather", ax=ax1)
sns.pointplot(data = train, x="datetime:hour", y="count", hue="season", ax=ax2)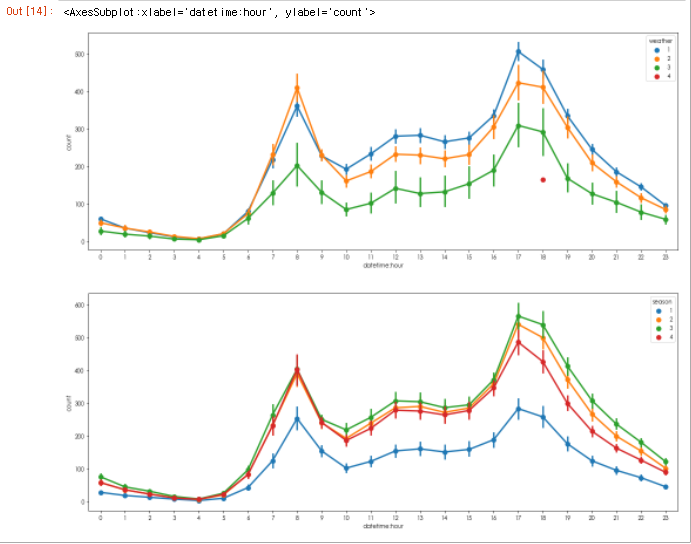
시각화 5
▶ NameError : name 'corrMatt' is not defined
corrMatt 을 맨 처음에 정의할 때 carrMatt로 정의한 것이 원인이다.
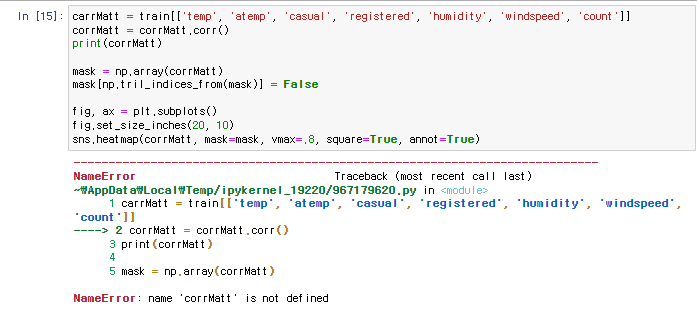
corrMatt = train[['temp', 'atemp', 'casual', 'registered', 'humidity', 'windspeed', 'count']]
corrMatt = corrMatt.corr()
print(corrMatt)

mask = np.array(corrMatt)
mask[np.tril_indices_from(mask)] = False

fig, ax = plt.subplots()
fig.set_size_inches(20, 10)
sns.heatmap(corrMatt, mask=mask, vmax=.8, square=True, annot=True)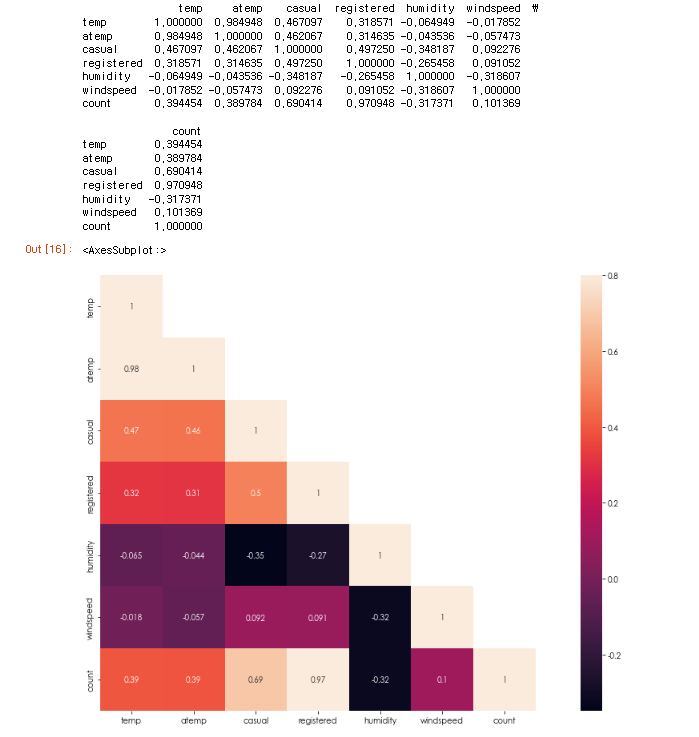
시각화 6
import matplotlib.pyplot as plt
%matplotlib inline
import seaborn as sns
import numpy as np
import pandas as pd

fig, (ax1, ax2, ax3) = plt.subplots(ncols=3)
fig.set_size_inches(12, 5)

sns.regplot(x='temp', y='count', data=train, ax=ax1)
sns.regplot(x='windspeed', y='count', data=train, ax=ax2)
sns.regplot(x='humidity', y='count', data=train, ax=ax3)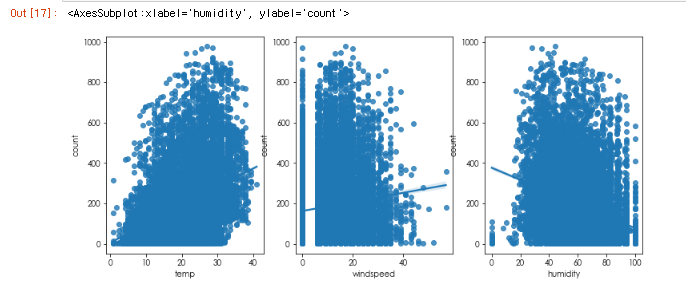
[참고]
https://www.analyticsvidhya.com/blog/2015/06/solution-kaggle-competition-bike-sharing-demand/
Solution To Kaggle Competition: Bike Sharing Demand
This article is a solution to kaggle bike sharing demand prediction using Rstudio cover feature engineering and random forest modeling to improve performance.
www.analyticsvidhya.com
캐글(Kaggle) 자전거 수요 예측 -1
데이터 다운로드 아래 링크에 데이터셋을 다운로드할 수 있습니다. Bike Sharing Demand Forecast use of a city bikeshare system www.kaggle.com 데이터 분석 데이터를 확인합니다. Train data 는 10886 개의..
jvvp.tistory.com
https://m.blog.naver.com/suresofttech/221548336143
Kaggle 플랫폼을 활용한 데이터 분석 역량 키우기
4차 산업혁명 시대가 시작되면서 빅데이터 분석 및 인공지능에 대한 관심이 엄청나게 증가했습니다. 그리고...
blog.naver.com
https://hong-yp-ml-records.tistory.com/17?category=823206
[Bike Sharing Demand] 캐글 자전거 수요예측 part 1
Bike Sharing Demand 이 대회에서 참가자들은 워싱턴 DC의 Capital Bikeshare 프로그램에서 자전거 대여 수요를 예측하는 Competition 입니다. Introduction 본 대회는 Regression에 관련된 문제로, 도시 전역의..
hong-yp-ml-records.tistory.com
'[Data Science] > Data Analysis' 카테고리의 다른 글
| [Python/Jupyter Notebook]CSV 파일 합치기 (0) | 2022.05.09 |
|---|---|
| [Bike Sharing Demand]비즈니스 이해 - 자전거 공유 시스템 (0) | 2022.04.27 |
| [Bike Sharing Demand]비즈니스 이해 - Washington D.C. Weather (0) | 2022.04.22 |
| 논문 해석 (0) | 2022.04.22 |
| [Bike Sharing Demand]비즈니스 이해 - Capital bikeshare (0) | 2022.04.21 |